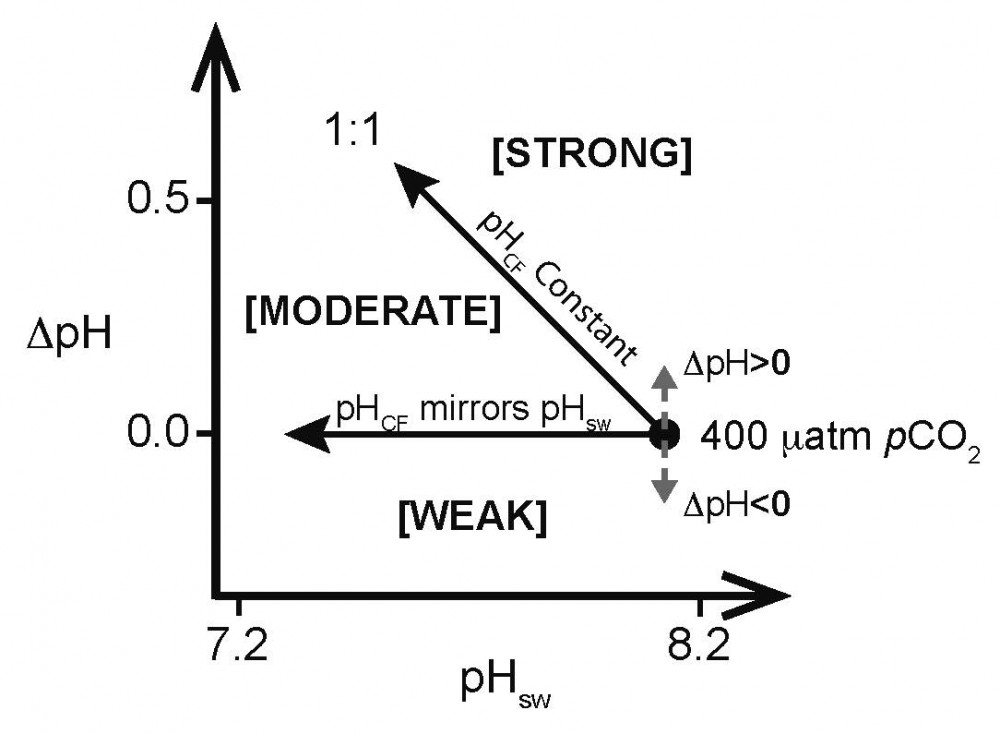
Schematic diagram of the “pH control envelope” to aid interpretation of ΔpH trends as a function of pHsw.
The upper boundary of the pH control envelope is defined by a 1:1 relationship between ΔpH and pHsw, such that pHCF remains constant regardless of pHsw. The lower boundary is defined by the scenario in which ΔpH remains fixed regardless of pHsw, such that changes in pHCF track changes in pHsw. The envelope therefore describes three categories of pHCF control: weak control at or below the lower bound of the envelope, moderate control within the envelope, and strong control at or above the upper bound of the envelope. The apex of the envelope is translated up or down relative to ΔpH = 0 if pHCF is respectively greater or less than pHsw under control pCO2 conditions. Our results suggest that all 10 species elevate their calcification site fluid pH to above seawater pH under elevated atmospheric CO2.
