Field Experiences
- 2008 - present Maintain the seismic stations of the Broadband Array in Taiwan for Seismology (BATS)
- 2008 - 2013 Maintain the downhole seismic array in Hualien (大漢工專 & 榮工大理石場)
- 2008 - 2013 Maintain the strainmeter stations in eastern Taiwan
- 2009 Install satellite master station (Very Small Aperture Terminal system, VSAT) at IES
- 2009 - 2010 Deploy satellite broadband seismic stations at Dongsha and Nansha Islands (東沙&南沙)
- 2009 - present Install and maintain seismic and geodetic stations in the Solomon Islands
- 2010 - present Install and maintain seismic stations in the Northern Luzon, Philippines
- 2010 - 2019 In charge of deploying the dense geophone array in Penghu area for the Across Taiwan-Strait Explosion Experiment (ATSEE) project
- 2010/03 Deploy the temporal seismic array for the 2010 MW 6.3 Kaohsiung earthquake sequence (lead by Dr. Wu-Cheng Chi)
- 2011 - present Install and maintain the building array at TAIPEI101 (including seismometer, accelerometer, and rotational sensors)
- 2012/12 Participate in the deployment of the Linear Seismic Array in Vietnam
- 2015 - present Participate in the seafloor GNSS/Acoustic Measurement Experiment in the northeastern, eastern, and southwestern seas of Taiwan (lead by Dr. Horng-Yue Chen)
- 2018/02 Deploy the temporal dense seismic array for the aftershock sequence of the 2018 MW 6.4 Hualien earthquake (lead by Prof. Hao Kuo-Chen)
Responsible Services at IES
- 2011 - 2017 Setup and maintain real-time seismic processing system for the Taiwan Volcano Observatory at Tatun (TVO)
- 2012 - 2013 Setup earthquake early-warning system for the wafer fabrication facility (fab) of TSMC (台積電) project
- 2017/03 - present In charge of the real-time seismic data acquisition of BATS
- 2017/03 - present In charge of the real-time seismic data exchange between IES and several institutions: Central Weather Bureau (CWB), Taiwan; Incorporated Research Institutions for Seismology (IRIS), USA; National Research Institute for Earth Science and Disaster Resilience (NIED), Japan; Fujian Earthquake Agency (FJEA), China
- 2019 - present Setup real-time seismic data exchange between IES and National Center for Research on Earthquake Engineering (NCREE), Taiwan
- 2020/06 - present Setup and maintain the real-time seismic data acquisition for the Taiwan Chelungpu-fault Drilling Project (TCDP)
Research Accomplishments
In the past few years, I focus on studying the seismic data recorded at the seismic network deployed in the western Solomon Islands (Fig. 1). The study site is located in the southwestern Pacific, an active subduction zone between Pacific and Australian plates and is one of the most seismically active areas in the world. It has been recently struck by MW 8.1 and MW 7.1 earthquakes those occurred in 2007 and 2010, respectively, both causing severe seismic hazards and triggering disastrous tsunami (Taylor et al., 2008; Chen et al., 2009; Miyagi et al., 2009; Newman et al., 2011; Kuo et al., 2016). Since the end of 2009, a research team that involved Academia Sinica, National Taiwan University, and the University of Texas at Austin has started a series of investigations at the western Solomon Islands. The seismic network that combines the broadband seismograph and continuous GPS receivers was deployed around the rupture zone of the 2007 earthquake. This network provides valuable data for further seismological and geological investigations. The monitoring observation has been carried out for this area (Kuo et al., 2016; Ku et al., 2018, 2020).
The seismic velocity model is fundamental for any study region. At first, a genetic algorithm (GA) was conducted to determine a 1-D crustal velocity model by minimizing the misfit between observed data and the theoretical dispersion curves predicted by the Computer Programs in Seismology (CPS; Herrmann, 2013). The observed dispersion curves are derived from the Rayleigh-wave cross-correlograms between each station pairs, and the averaged dispersion curve is used as the input for GA inversion. An averaged model, the WSOLOCrust model, was proposed in this study (red line in Fig. 2). The WSOLOCrust model exhibits a Moho depth of 20.4±1.5 km and a thickness for the upper crust of 6.9±0.4 km. The Vs values and corresponding VP/VS ratios of the upper crust, the lower crust, and the uppermost mantle are 2.62±0.04, 3.54±0.14, and 4.10±0.10 km/sec and 1.745, 1.749, and 1.766, respectively. By comparing the travel time residuals for 54 local events, the averaged RMS value of travel time residuals from the WSOLOCrust model has an average 0.85- and 0.16-sec improvements compared to the results of iasp91 (Kennett and Engdahl, 1991) and CRUST 1.0 (Laske et al., 2013) models, respectively (Fig. 3). The advantage of this work using ambient noise and applying the GA to develop the velocity model is avoiding the trade-off between a velocity model and the hypocenter location. The WSOLOCrust model can hence be a better reference velocity model for seismic study and further help to locate small local earthquakes. This model will be necessary and essential for understanding the local tectonic structure (Ku et al., 2018).
Later, the lateral variations of 1-D velocity models beneath stations were further investigated using the joint inversion of receiver functions and surface-wave dispersion curves. The seismograms of teleseismic events for receiver functions analysis and surface- wave dispersion curves are satisfied with the criteria that the epicentral distance of 30°- 90° with MW > 5.5 and epicentral distance of 10°-60° with MW > 6.0, respectively. The example of the results for receiver functions, surface-wave dispersion curves, and the joint inversion for station HUSU are shown in Figures 4 and 5. The resulting velocity models show a highly variable crustal structure across the study region (Fig. 6). The Moho depths beneath the stations range from 25 to 40 km. A low-velocity zone (LVZ) was observed at most seismic stations in this work. This study provides preliminary station-based velocity models from joint inversion, and denser coverage of broadband seismic stations will be needed to integrate a 3-D velocity model for the region (Ku et al., 2020).
All works described above will be constructive for future research (e.g., apply velocity model on waveform inversion to calculate the focal mechanisms of local earthquakes) in the Solomon Islands, and more details, please refer to the published papers (Ku et al., 2018, 2020).
Figures
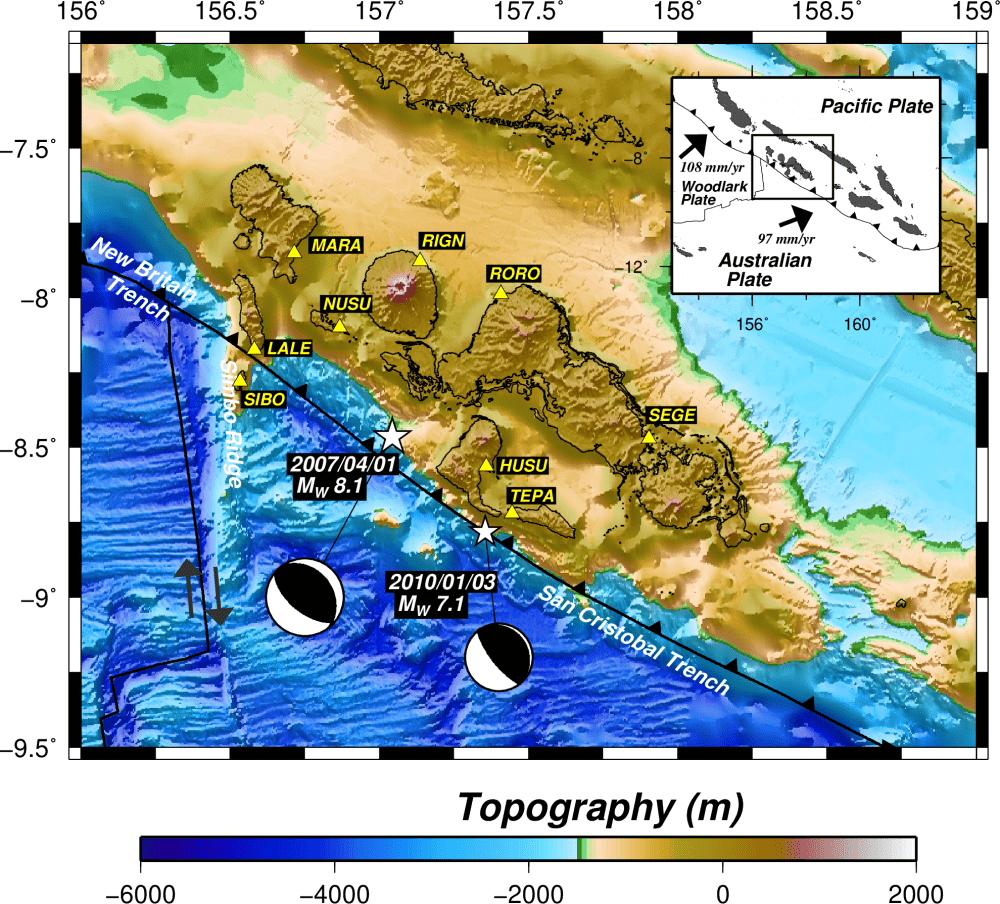
Figure 1. The map displays the bathymetry and the distribution of seismic stations (yellow triangles). Two white stars and relative beach balls indicate the epicenters and focal mechanisms of the earthquakes that occurred in 2007 and 2010, respectively. The inset shows the plate tectonic setting around the Solomon Islands (black box represents the study area in the western Solomon Islands). The triple junction is located where the Pacific, Australian, and Woodlark plate boundaries intersect.
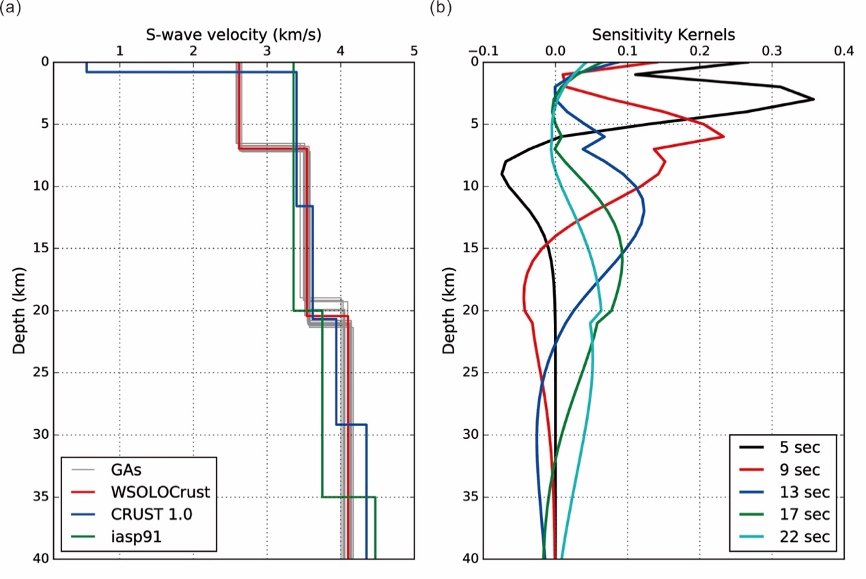
Figure 2. (a) The gray line indicates the best model from each GA searching. The WSOLOCrust model is the average 1-D velocity model of GA models (red line). The blue and green lines represent the local CRUST 1.0 and the global iasp91 velocity models, respectively. (b) Sensitivity kernel of Rayleigh wave group velocity at selected periods, kernels are calculated with the WSOLOCrust model. This figure is from Ku et al., 2018.
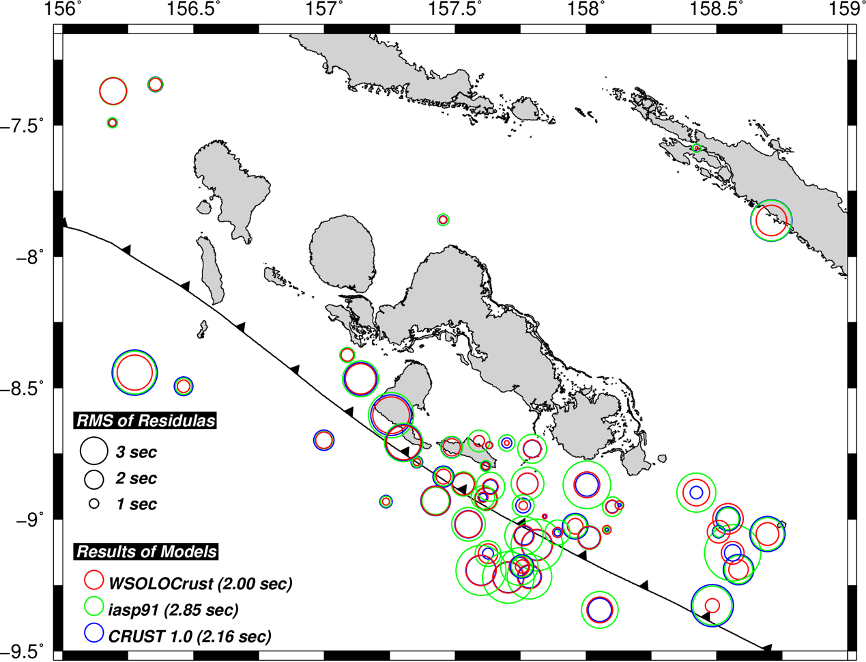
Figure 3. Different models are applied to calculate the RMS of residuals during each event. The open circles indicate the epicenters of earthquakes. The size of the circle means the RMS of residuals (in sec) obtained from the difference between the observed and predicted travel times. The different colors represent results obtained from different models. This figure is modified after Ku et al., 2018.
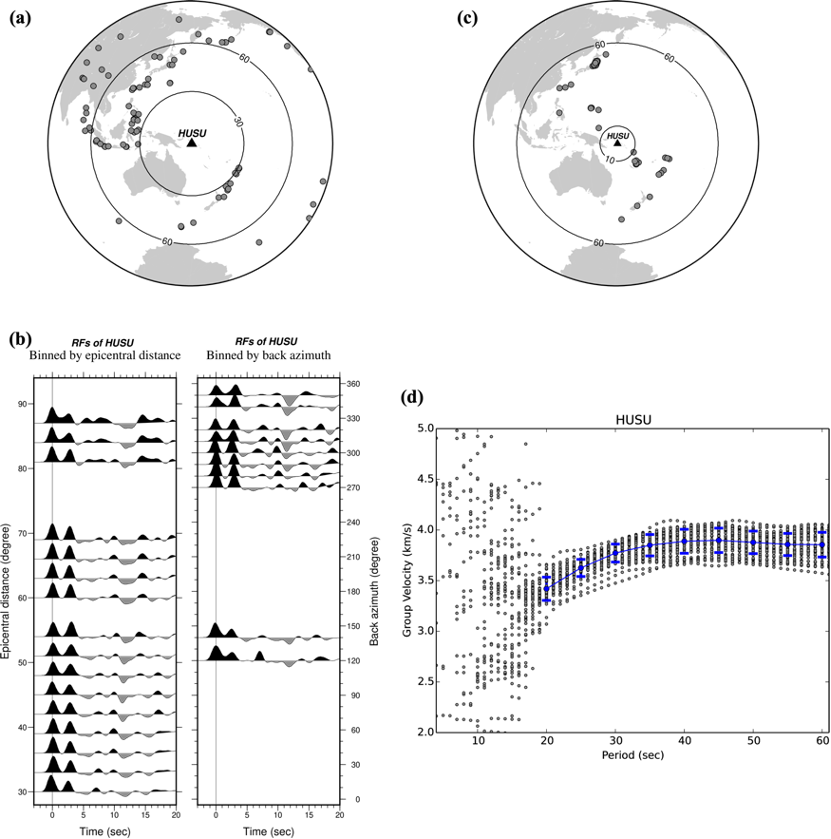
Figure 4. Examples are illustrating receiver functions and surface-wave group velocities for station HUSU. (a) The events (gray circles) used in the receiver function analysis for station HUSU (black triangle). (b) All the receiver functions of station HUSU. For better illustration, the waveforms have been stacked by epicentral distance (5° bins with an increment of 3°) and back azimuth (5° bins with an increment of 10°). Only stacking traces that events number in each bin greater than five are plotted. (c) The earthquakes distribution (gray circles) of station HUSU (black triangle) for the Rayleigh-wave group velocity measurements. (d) The gray circles indicate the group velocity values of different events. The blue circles and error bars indicate the average group velocity and one standard deviation of periods from 20 to 60 s with interval 5 s, respectively. This figure is modified after Ku et al., 2020.
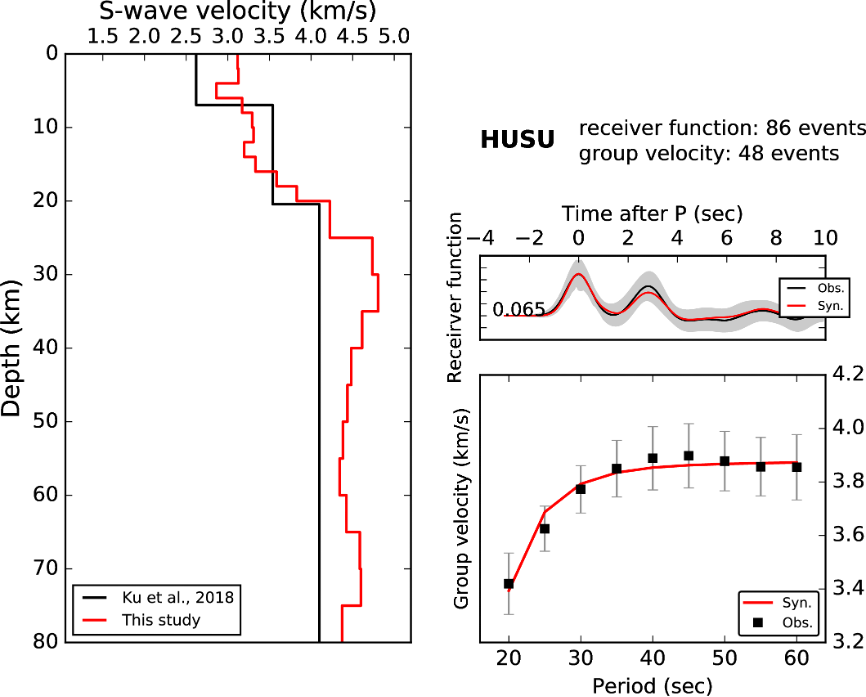
Figure 5. Examples show the results of joint inversion for station HUSU. The numbers of events used in receiver function analysis and group velocity measurements are displayed on the top. On the left side of the figure, the red and black lines indicate the inversion model and an average local model (Ku et al., 2018), respectively. On the right and top of the figure, the comparison between observed (black line) and synthetic (red line) receiver functions. The gray shadow means one standard deviation of the observed receiver functions. The black numbers in front of waveforms indicate the average ray parameter of observed receiver functions. On the right and bottom of the figure, the black squares and gray error bar mean the average group velocities and relative one standard deviation with different periods, as the observed data. The red line indicates the synthetic group velocity. This figure is modified after Ku et al., 2020.
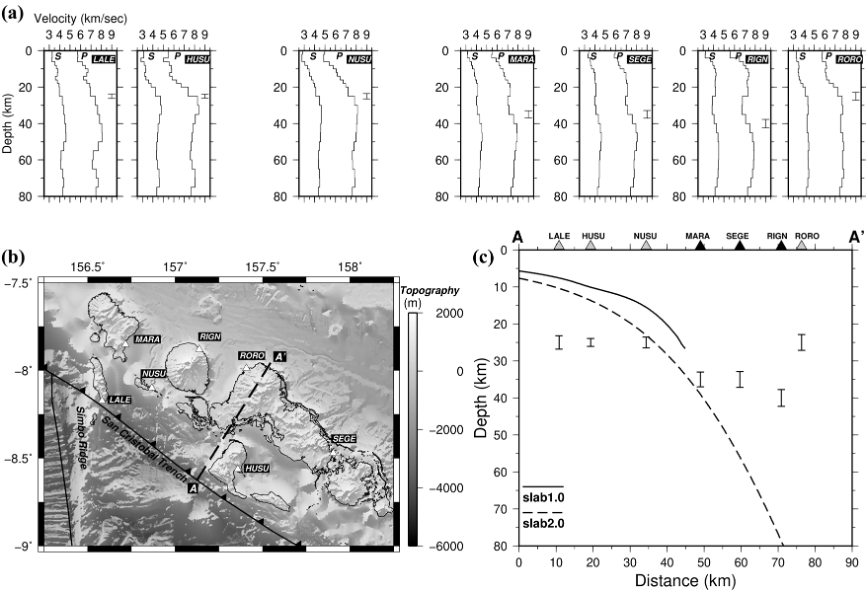
Figure 6. The summary of 1-D velocity models and project the results onto a vertical profile (line AA’). (a) P- and S-wave velocity models for each station. Black error bars show possible Moho depth range (MDR) beneath stations. (b) The map shows the distribution of seismic stations (white triangles) and the location of the AA’ line (dashed line). The results of all stations are projected onto the line AA’. (c) This figure shows the vertical profile of line AA’. The solid and dashed lines indicate Slab 1.0 and Slab 2.0 models, respectively. Triangles present the location of the stations and the distance from the trench; three black triangles mean stations with deeper Moho depth. Black error bars show possible MDR as the same as that shown in (a). This figure is modified after Ku et al., 2020.
References
- Chen, T., A. V. Newman, L. Feng, and H. M. Fritz (2009). Slip distribution from the 1 April 2007 Solomon Islands earthquake: A unique image of near-trench rupture, Geophys. Res. Lett. 36, 6–11.
- Herrmann, R. B. (2013). Computer Programs in Seismology: An Evolving Tool for Instruction and Research, Seismol. Res. Lett. 84, 1081–1088.
- Kennett, B. L. N., and E. R. Engdahl (1991). Travel times for global earthquake location and phase association, Geophys. J. Int. 105, 429–465.
- Ku, C. S., Y. T. Kuo, W. A. Chao, S. H. You, B. S. Huang, Y. G. Chen, F. W. Taylor, F. W. Taylor, and Y. M. Wu (2018). A First-Layered Crustal Velocity Model for the Western Solomon Islands: Inversion of the Measured Group Velocity of Surface Waves Using Ambient Noise, Seismol. Res. Lett. 89, 2274–2283.
- Ku, C. S., Y. T. Kuo, B. S. Huang, Y. G. Chen, and Y. M. Wu (2020). Seismic velocity structure beneath the Western Solomon Islands from the joint inversion of receiver functions and surface-wave dispersion curves, Seismol. Res. Lett Journal of Asian Earth Sciences 195, 104378.
- Kuo, Y. T., C. S. Ku, Y. G. Chen, Y. Wang, Y. N. N. Lin, R. Y. Chuang, Y. J. Hsu, F. W. Taylor, B. S. Huang, and H. Tung (2016). Characteristics on fault coupling along the Solomon megathrust based on GPS observations from 2011 to 2014, Geophys. Res. Lett. 43, 8519–8526.
- Laske, G., G. Masters, Z. Ma, and M. Pasyanos (2013). Update on CRUST 1.0: a 1-degree global model of Earth’s crust, Geophys. Res. Abstr. 15, EGU2013-658
- Miyagi, Y., T. Ozawa, and M. Shimada (2009). Crustal deformation associated with an M8.1 earthquake in the Solomon Islands, detected by ALOS/PALSAR, Earth Planet. Sci. Lett. 287, 385–391.
- Newman, A.V., L. Feng, H. M. Fritz, Z. M. Lifton, N. Kalligeris, and Y. Wei (2011). The energetic 2010 MW 7.1 Solomon Islands tsunami earthquake, Geophys. J. Int. 186, 775–781.
- Taylor, F. W., R. W. Briggs, C. Frohlich, A. Brown, M. Hornbach, A. K. Papabatu, A. J. Meltzner, and D. Billy (2008). Rupture across arc segment and plate boundaries in the 1 April 2007 Solomons earthquake, Nature Geoscience 1, 253–257.
